
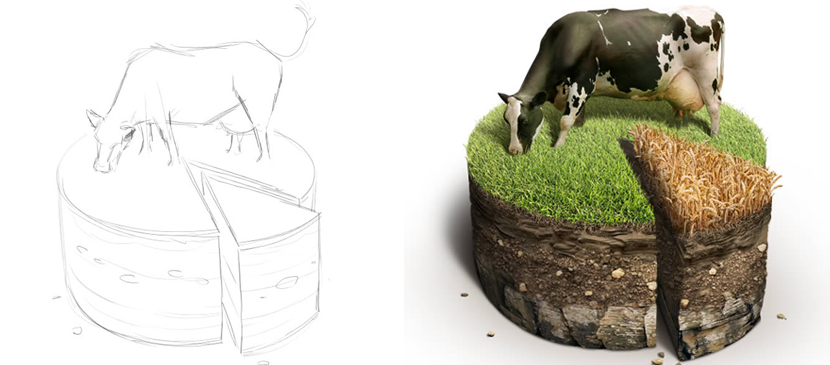
Making a Special Pie Chart in Farming Style
June 25, 2013
Drawing Effect, Photoshop Tutorial
Infographics are an efficient and fun way to present data. You may notice, however, that infographics are often flat vector illustrations. In this tutorial, we will show you how to create a soil cake using photographic elements for use in pie charts. Let’s get started!