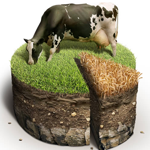
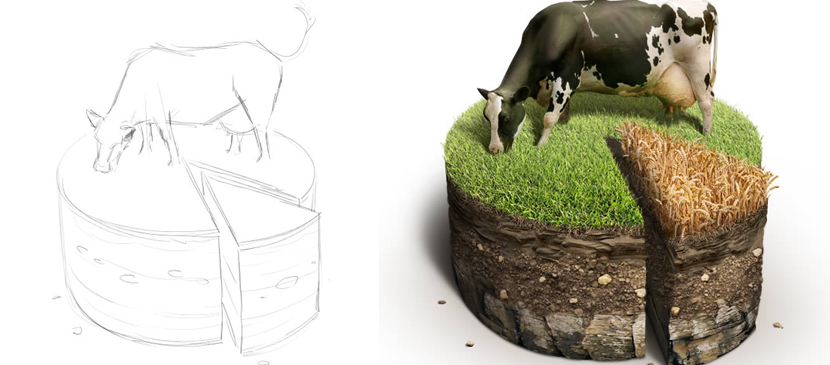
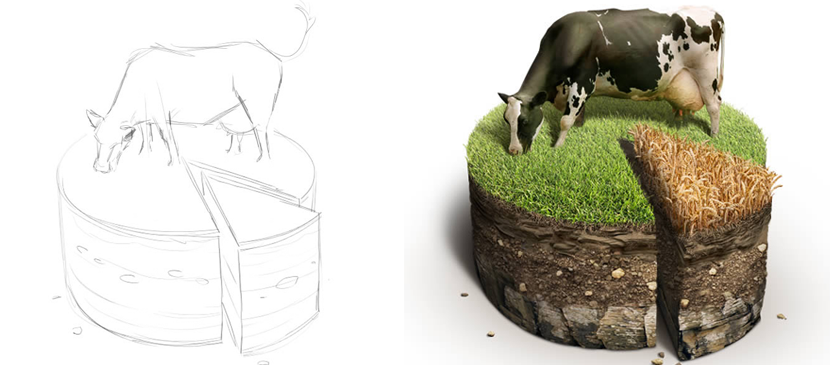
Infographics are an efficient and fun way to present data. You may notice, however, that infographics are often flat vector illustrations. In this tutorial, we will show you how to create a soil cake using photographic elements for use in pie charts. Let’s get started!
中文: 暂无 中文 翻译。查看英文版 — showing the original English article below.
Making a Special Pie Chart in Farming Style
中文
Photoshop Lady 精选内容
专业指南、评测和技巧直接送达您的收件箱。无垃圾邮件,随时退订。